1
2
3
4
5
6
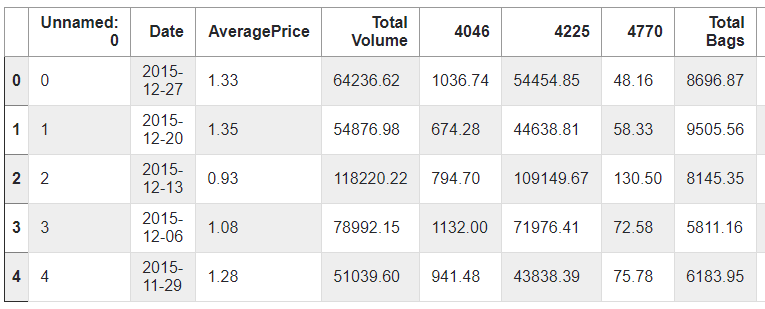
| import pandas as pd
import matplotlib.pyplot as plt
df = pd.read_csv('datasets/avocado.csv')
df.head()
|

1
| df['AveragePrice'].head()
|
0    1.33
1    1.35
2    0.93
3    1.08
4    1.28
Name: AveragePrice, dtype: float64
0    1.33
1    1.35
2    0.93
3    1.08
4    1.28
Name: AveragePrice, dtype: float64
1
2
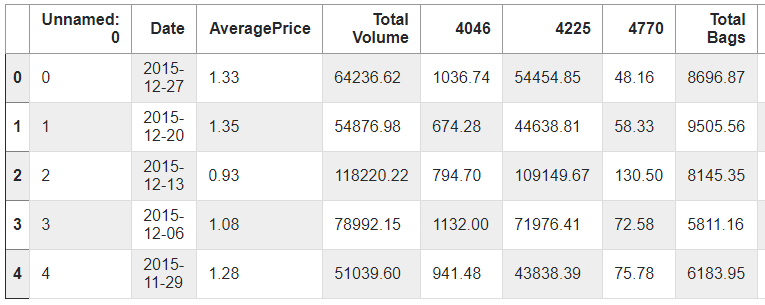
| albany_df = df[df['region'] == 'Albany']
albany_df.head()
|
Int64Index([    0,     1,     2,     3,     4,     5,     6,     7,     8,
                9,
            ...
            17603, 17604, 17605, 17606, 17607, 17608, 17609, 17610, 17611,
            17612],
           dtype='int64', length=338)
1
2
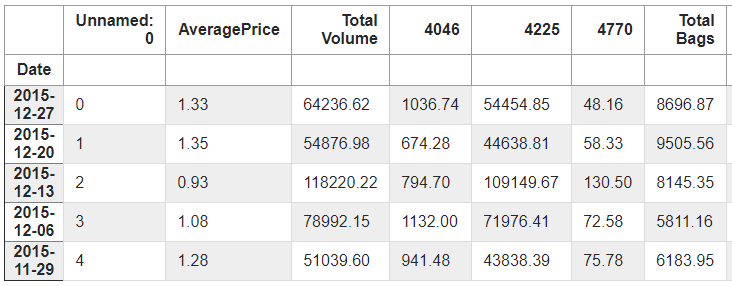
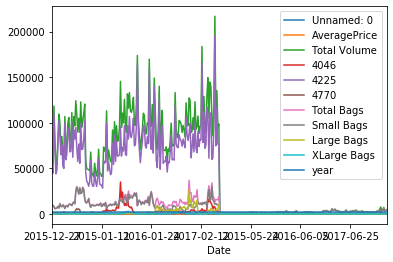
| albany_df = albany_df.set_index('Date')
albany_df.head()
|
Index(['2015-12-27', '2015-12-20', '2015-12-13', '2015-12-06', '2015-11-29',
       '2015-11-22', '2015-11-15', '2015-11-08', '2015-11-01', '2015-10-25',
       ...
       '2018-03-11', '2018-03-04', '2018-02-25', '2018-02-18', '2018-02-11',
       '2018-02-04', '2018-01-28', '2018-01-21', '2018-01-14', '2018-01-07'],
      dtype='object', name='Date', length=338)
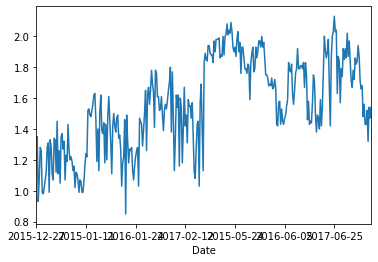
<matplotlib.axes._subplots.AxesSubplot at 0x15c18c71e88>
1
| albany_df['AveragePrice'].plot()
|
<matplotlib.axes._subplots.AxesSubplot at 0x15c18ad00c8>